|
Notes /
KmemleakInstalling a Kernel with the RT PatchDecember 09, 2014 The ProblemI am working on a system that is tolerant to transient faults. This system exploits the The simplest system which demonstrates this behavior consists of two identical processes (let's call them replicas). When signaled, a replica will duplicate itself by using the The timing be is displayed in the graph below. I first noticed the poor behavior when running my full system, and have since stripped out just about everything. This happens in a non RT-kernel. And as far as I can tell, there are no memory leaks in my replica code. 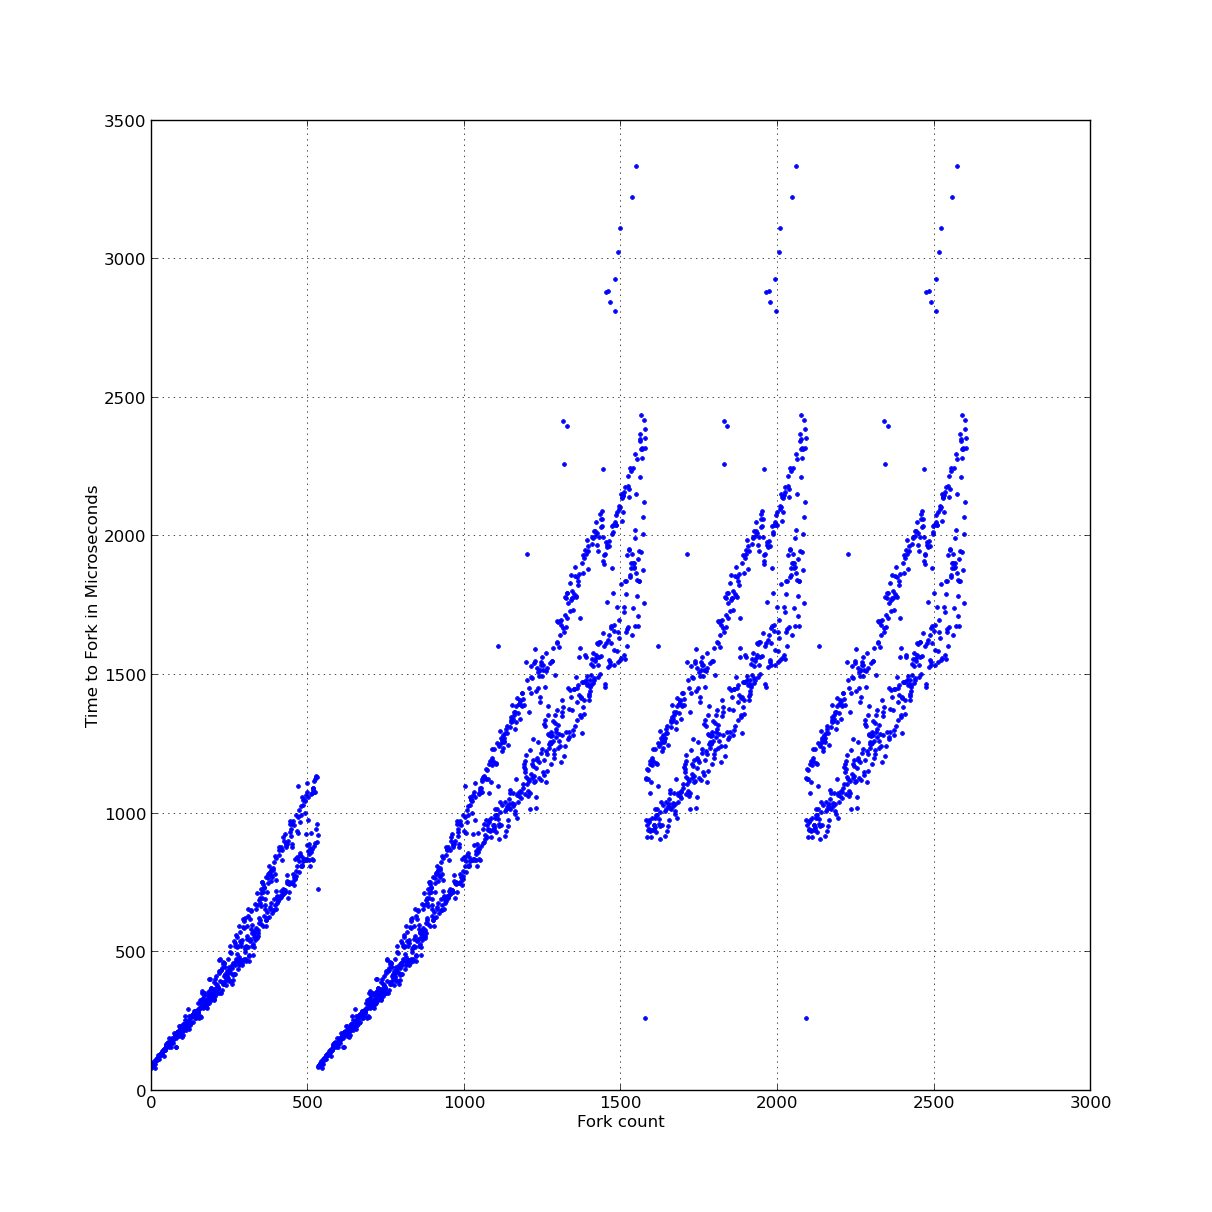 Full Poster: Timing of fork operation For more information, see my StackOverflow question. How can I say with any confidence that my code does not have any memory leaks? This is c after all, and I am hardly a competent programmer. The answer is Valgrind, a great set of tools that can detect a large number of leaks. It is extremely easy to setup and run. > sudo apt-get install valgrind > valgrind ./program_name arg1 arg2 ... argn. It did take a bit of code to isolate my components, but well worth the effort. Let's just say that my linked list code was a bit flawed. The number of leaks that Valgrind uncovered and that I fixed gave me confidence that the performance problem was my fault, and that I had fixed it. Measurements of the system showed negligible improvement. The next problem I tackled was the mysterious error message about the system running out of file descriptors. Sure enough, a quick check of 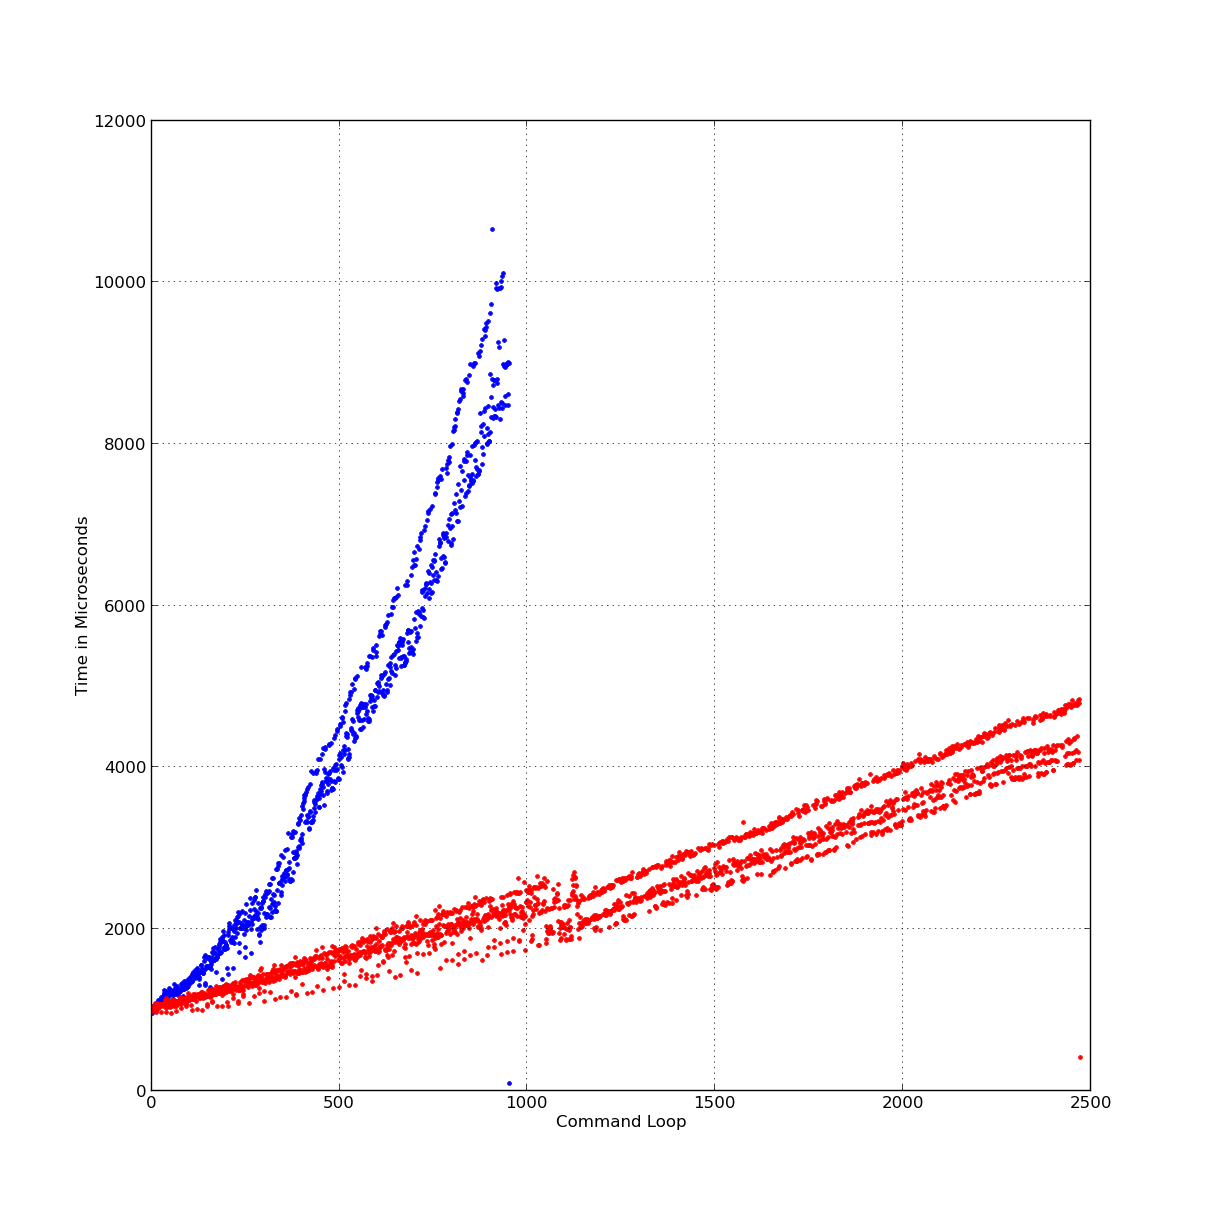 Full Poster: Less bad; still not good. What's next? I looked into a few different things, all to no avail. This is the point at which I posted the SO question. KmemleakThen I found https://www.kernel.org/doc/Documentation/kmemleak.txt. Have to reconfigure my kernel / a kernel to use kmemleak. In kernel source: > edit Makefile to have a new extraversion > make menuconfig Initially I was unable to find the option. It's not the easiest program to use. Hit '/' to search for "KMEMLEAK", and in the results dependencies are listed. One of the dependencies is "!MEMORY_HOTPLUG", which was shown to be enabled. So, search for "MEMORY_HOTPLUG", which shows that it is located in "Processor type and features," and look for "Allow for memory hot-add". Set as disabled. Back to "Kernel Hacking," "Kernel memory leak detector" now shows up. Set the number of log entries because some person on blogspot suggested it. >> In Kernel hacking select "debug slab memory allocations" and "memory leak debugging" (I hope) > fakeroot make-kpkg -j 4 --initrd --revision=3.2.55.RTpatch kernel_image (this takes a while, longer if you neglect -j #) Another failed attempt.Kernel Data Structures - This was another failed avenue. The Actual FixLearning how to configure kmemleak was... fun. But it didn't reveal the problem. The problem that the Linux kernel tracks anonymous vma (such as used by a process' heap and stack) with a chain data structure. When breaking ancestry (having the parent killed, but the children continuing to run) prevents this chain from ever being cleaned up. It keeps growing. The problem was known, and a patch already exists. See my SO answer to my question. TODO: update with a chart showing the resolved problem. |