|
Notes /
TimingInterruptsAccounting for InterruptsMay 15, 2014 MotivationMy system is set up for experiments. My kernel now has the RTPatch. I'm ready to take some basic benchmarks. But this is what I get for a simple round-trip test: 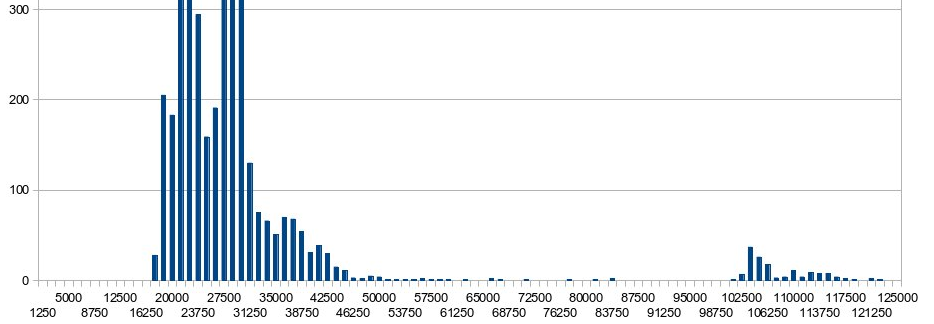 Histogram of round-trip times. X-Axis: Number of Cycles Y-Axis: Number of Occurrences The top of the chart as been chopped. The large cluster to the left is just about how we thought the baseline time measurements should fall. The problem is that smaller bump to the far right. Why are a minority of round trip times so much larger? The first suspect: interrupts. Detecting / Timing InterruptsThe number of interrupts handled by each core is conveniently recorded, and can be checked with: To get an estimate on how long it takes for an interrupt to be handled, from user-space, one can check the current time in a type loop. If the time that has elapsed is significantly longer than expected, an interrupt has likely occurred. This is what the following snippet does, using rdtsc (source): last_int_count = oldParse();
rdtscll(start_time);
rdtscll(last_time);
while (next_result_index < result_count) {
rdtscll(curr_time);
results_time[next_result_index] = curr_time - last_time;
if (results_time[next_result_index] > threshold) {
next_result_index++;
}
last_time = curr_time;
}
rdtscll(end_time);
curr_int_count = oldParse();
This code records an estimate of the number of interrupts that have occurred, and records the time each interrupt took. The function With this program tested and working, the next task is to actually examine the data. Everything is printed to the console (after all readings have been taken to ensure that we are not measuring how long While excel / calc are useful programs, they are tools much better suited to crunching this kind of data, such as the matplotlib library for python. I just used it to create some histograms, which is barely scratching the surface of its capabilities. So, with a quick program such as this (source): import numpy as np
import matplotlib.pyplot as plt
data_file = open("./TimingTicks/HundredThousandInterruptions_new.txt", "r")
print data_file.readline()
x = []
for index in range(0, 100000):
x.append(int(data_file.readline()))
plt.figure(figsize=(12, 5))
n, bins, patches = plt.hist(x, 150, facecolor='g')
plt.xlabel('Time in Cycles')
plt.ylabel('Count')
plt.grid(True)
plt.show()
I get the plot shown below. 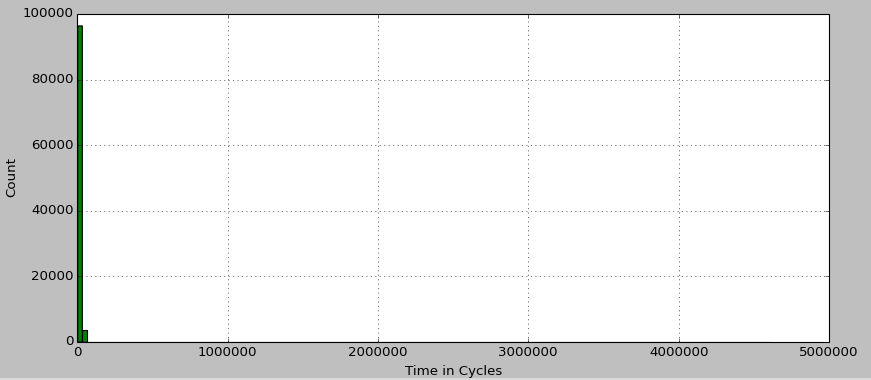 Histogram of interrupt times. Clearly there is something wrong with matplotlib! That, or my data had a few outliers that I hadn't noticed before. Let's put the numbers into perspective: The loop in which But there are two outliers, which each clock in just over a whopping 4,500,000 cycles (about 1.5 milliseconds)! With these outliers removed, the histogram looks a lot better: 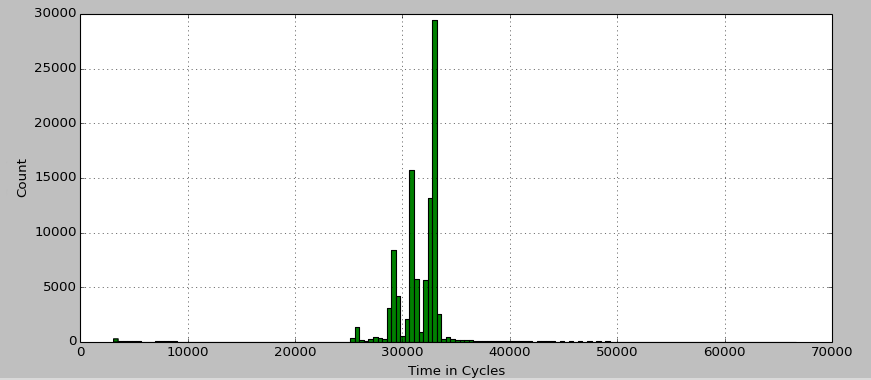 Histogram of interrupt times with outliers removed. This is much more in line with the expected results. But what about the outliers? Clearly they must be accounted for. Part 2May 22, 2014 Moving OnBy "clearly they must be accounted for" I actually mean, "I am not going to account for them." At least not for now. In coming to this conclusion, I have made several attempts to track down the source of the latency, but am no closer to understanding the origin. Right now, my best guess is that there is a Non-Maskable Interrupt (NMI) that I'm just going to have to keep an eye out for. But the search itself was fruitful. KernelThe Linux kernel provides several debugging tools, including latency histograms for certain operations. Unfortunately the ones I looked at all showed latencies well under the 1.5 millisecond mark. However, this does imply that the latency is not from the kernel itself, but something outside of its control, such as a NMI. I also tried a different kernel version / rt-patch set to help rule out a kernel bug / quirk. This did not resolve the situation either. See RT Patch for additional notes. CyclictestThrough a rtwiki guide and an EMSOFT paper, I found out about Cyclictest; a standard tool used to measure latency in many systems.
TODO: Explain options, try Cyclictest with a round-robin scheduler. System Management ModeIn particular, System Management Interrupts (SMI). A sub-type of NMIs. I stumbled upon these while reading a guide on building rt application on rtwiki. Unfortunately the document is a bit out of date. The guide mentions possible problems with SMIs causing extended latencies, especially dealing with USB devices. However, as far as I could tell, the USB issues had no affects on my system. I even dug out an old ps2 mouse and keyboard to test this one. In the course of researching my system's chipset (look for the Hyper-ThreadingThrough this hunt, I did discover that my system has hyper-threading. With hyper-threading enabled, my previous results where completely bunk and unreliable. The easiest way to disable hyper-threading is through BIOS settings if available. Another option is to individually turn off the CPUs which actually represent the second thread on a core. The terminology here gets confusing. A processor has 1 to many cores, and each core presents Linux with 1 (no hyper-threading) or 2 (hyper-threading) CPUs. CPUs can be turned on and off by writing a 1 or a 0 to the file Now, the baseline measurement looks much improved (outliers > 1000000 cycles removed): 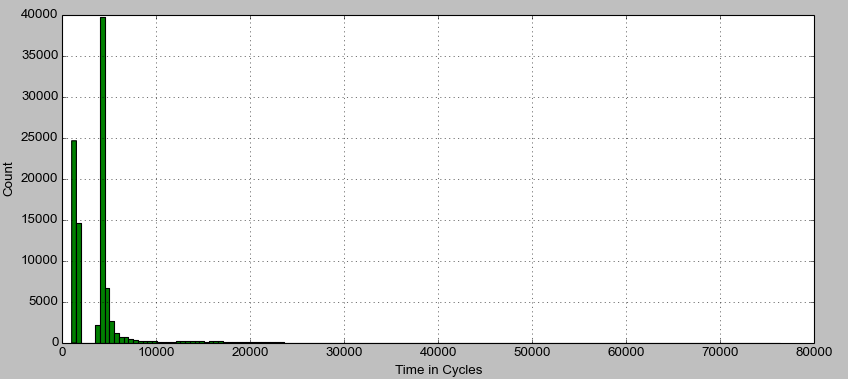 Histogram of interrupt times (no Hyper-threading). There are still some outliers, but for the most part latency is well below what it was before. The next step is to try and re-run the original round-trip measurements. 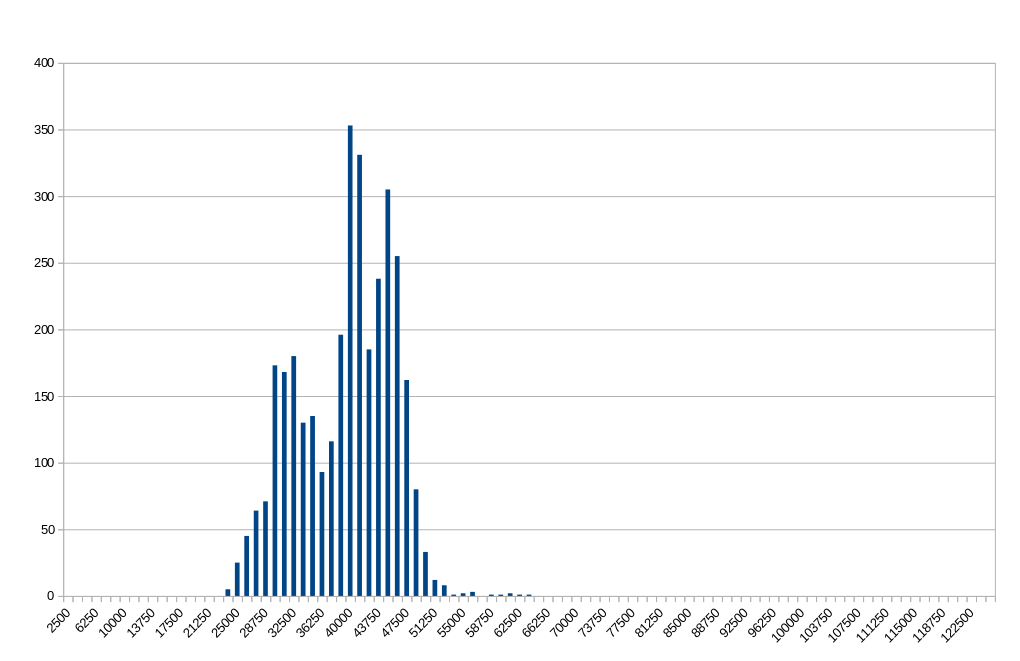 Round-Trip Finally, this is starting to look reasonable! Compared to the original measurements, the round-trip times have on average increased, but the worst case execution times have decreased. This is what one would expect when moving to a real-time system. |