


|
Fast scanning microcalorimetry studies of water and aqueous solutions
Background
One of the goals of theoretical and experimental research into the structure and dynamics of condensed aqueous phases is to provide insights into the relationships between various non-crystalline forms of H2O, i.e., liquid, supercooled, and glassy (amorphous)1-3. ASW is a well-known example of a glassy state of H2O1-2, which is the primary focus of our current fast scanning calorimetry studies. In spite of decades of intense theoretical and experimental efforts, a consistent view of the interrelationships between non-crystalline phases of H2O has yet to be developed.
A vivid example of lack of understanding in the field is the controversy surrounding the continuity hypothesis, which postulates a direct structural and dynamic relationship between ASW at temperatures above 136 K and liquid water at temperatures near ambient3. According to the continuity hypothesis, various dynamic properties of ASW, such as self diffusivity, viscosity, and enthalpy relaxation time, can be related to those measured for liquid water at temperatures above 260 K via a simple Vogel-Fulcher-Tamman (VFT) equation with the Vogel temperature of approximately 124K. Thus, according to the argument, ASW at temperatures above 124 K can be viewed simply as a deeply supercooled state of liquid water.
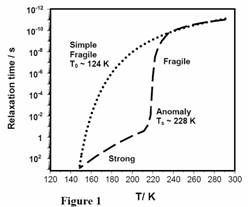
As shown in Figure 12, in the framework of the continuity hypothesis, the kinetic properties of supercooled water have a monotonous VFT-type behavior over the entire temperature range from cryogenic to ambient. In other words, water is assumed to be a fragile liquid with a characteristic glass transition temperature near 136 K. For the sake of convenience we will refer to this hypothesized behavior of water’s kinetic variables as Type I.
The continuity hypothesis described above has been the subject of considerable debate, primarily due to the fact that it excludes the possibility of anomalous variations in kinetic parameters (diffusivity, viscosity, relaxation time) near 228 K (Ts ). In particular, Angell and coworkers argued consistently that water may undergo an anomalous transition from a fragile to a strong liquid in the vicinity of Ts (see Figure 12), and that postulated Tg of 136 K is incorrect, and must be reassigned to a higher value 4. In Fig. 12, such behavior of kinetic parameters is marked as Type II. Recent experimental results provided further bases for this alternative argument. Nevertheless, the Type II conjecture is still not universally accepted, due to a number of experimental observations in which results seem to support the continuity hypothesis.
Taking into account the impasse in research on glass transition properties of ASW, it becomes clear that a strategy for resolving this important problem must be two-fold: First, the kinetic parameters have to be measured directly in pure bulk ASW samples in the temperature range from 170 to 240 K. Second, experiments which produced data consistent with Type I behavior must be explained. Immediately below we explain our strategies for pursuing these goals.
Relaxation time measurements with fast scanning calorimetry
Although we initially developed USC as an auxiliary technique for characterization of phase composition and dimensions of polycrystalline ice films in FTDS experiments, we realized early in our studies that USC can also be used to study relaxation processes in molecular glasses under conditions where such studies by dielectric spectroscopy and other techniques may not be possible. The central idea of these studies is illustrated in Fig. 2.
In differential scanning calorimetry (DSC) experiments the glass transition temperature (Tg) is essentially the temperature where the enthalpy relaxation time, trelaxation, becomes comparable to the time scale the experiment. Thus, as illustrated in Fig. 2, the temperature dependence of trelaxation can be measured in SC studies simply by varying the heating rate of the scan and monitoring the changes in Tg. For example, as we observed in USC experiments with vitreous toluene, the Tg under condition of rapid heating (105 K/s) was 130-135 K which is significantly higher than that observed in conventional (slow) differential scanning calorimetry experiments (approximately 117 K)5,7. Thus, according to our estimates the relaxation time in toluene in the vicinity of 130 K is approximately 10-5 seconds, which is numerically equal to the inverse of the heating rate, Q, of the scan.
In order to test the abilities of USC to provide a reasonable estimate of the trelaxation at high temperatures, we have compared the relaxation times for a number of molecular glasses measured with USC and those inferred from dielectric spectroscopy (DS) studies7. The results of this analysis are summarized in Fig 3 in the form of the correlation plot between the temperatures where trelaxation with dielectric spectroscopy is numerically equal to the inverse of the heating rate of our USC studies (10 -5 seconds). As shown in the figure, the glass transition temperatures observed in the USC experiments with a number of vitreous molecular solids are within 5K of the glass transition temperatures inferred from dielectric spectroscopy studies.
Current results
Using the ultrafast scanning microcalorimetry technique developed in our laboratory, we have conducted the first direct measurements of thermodynamic properties of pure and doped Amorphous Solid Water (ASW) in the temperature range from 160 to 230 K, i.e., in so called “No Man’s Land” of water research5,6. As shown in Figure 4, using the unique capability of the SC technique (heat capacity measurements during rapid heating of ASW samples), we were able to penetrate this previously inaccessible temperature range and to obtain insights into the relaxation kinetics in pure and doped ASW at temperatures up to 200 K.
The unexpected result of this study is the lack of a detectable glass transition at temperatures up to 200 K in pure ASW and the presence of a well manifested glass transition near 175 K in ASW doped with acetic acid. According to our analysis5, the relaxation time in pure ASW must be significantly lower than that determined in previous dielectric spectroscopy studies. In other words, results of our studies show that the assignment of the glass transition temperature in pure ASW is likely to be incorrect.
Figure 2 explains our findings5. It shows the relaxation time data in ASW from previous experiments, and those from our fast microcalorimetry studies. According to our results, Vogel temperature for pure unconfined ASW may be as high as 180 K, which is in stark contrast with previous work. We attribute the origins of this disagreement to the sensitivity of hydrogen bond network in ASW to two types of perturbations: confinement, and impurities. While our experiments were conducted with relatively pure ASW samples of near-macroscopic dimensions, the same is not true for many of the previous studies. We argue that confinement effects and the presence of impurities in ASW samples used in the past experiments are the main sources of the discord between our and previous measurements5.
The work described above resulted in a vigorous scientific debate7. In order to shed more light on the glass-transition phenomena in pure and doped ASW, we conducted a careful study of the variations in the glass endotherms of doped ASW with a range of concentrations of impurities6. As shown in Figure 6, when the mole fraction of CH3COOH in ASW is less than 0.04, the glass transition temperature in is nearly independent of the dopant concentration. Furthermore, when the mole fraction of CH3COOH is less than 0.04, the magnitude of the glass endotherm of doped ASW shows a linear dependence on concentration of impurities (not shown in Fig. 6). As we explain in in our upcoming publication, these results indicate that, although the bulk pure ASW is a glass at temperatures up to its crystallization, a guest molecule in ASW matrix may be enveloped in an ultraviscous liquid water at temperatures as low as 136 K. In the case of CH3COOH we estimate the diameter of such a viscous shell to be approximately 2.5 nm
References:
1. C. A. Angell, “Amorphous water”, Ann. Rev. of Phys. Chem., 55, 559, (2004)
2. P. G. Debenedetti, “Supercooled and glassy water”, J. Phys. Condens. Matter, 15, R1669, (2003)
3. See, for example G. P. Johari , “Water's character from dielectric relaxation above its T-g”, J. Chem. Phys., 105, 7079 (1996)
4. See for example A. Minoguchi, R. Richert, and C. A. Angell, “Dielectric studies deny existence of ultraviscous fragile water”, Phys. Rev. Lett., 93 (21), 215703, (2004).
5. M. Brindza, M. Chonde, and Vlad Sadtchenko, J. Chem. Phys. 125, 094501(2006) and references therein
6. “Glass Transition in Doped Amorphous Solid Water: Spatial Extent of Perturbations to Glass Transition Properties Induced by Impurities”, Stephanie A. McCartney, Haiping Lu, and Vlad Sadtchenko, J. Chem. Phys, submitted (2007) and references therein
7. “Response to “Comment on `Glass transition in pure and doped amorphous solid: An ultrafast microcalorimetry study' [J. Chem. Phys. 125, 094501 (2006)]”, Vlad Sadtchenko, Haiping Lu, and S. McCartney, J. Chem. Phys. 127, 157102 (2007) and references therein
|
|
Figure1 Two distinct views of molecular kinetics in Amorphous Solid Water (ASW). According to the Type I hypothesis ASW is simply a fragile liquid in the entire temperature range from cryogenic to ambient. In contrast, Type II hypothesis postulate a dramatic change in ASW properties near 220-230 K |
|
Type I |
|
Type II |
|
Vlad Sadtchenko, GW Chemistry |

|
Figure 2 Principles of relaxation time measurements with fast scanning calorimetry |

|
Figure 3 Correlation between relaxation time measured in fast scanning calorimetry and that from dielectric spectroscopy. |

|
Figure 4. Fast scanning calorimetry thermograms of pure ASW and ASW doped with CH3COOH (1:10). Due to high heating rates (105 K/s), we were able to obtain the data on thermal properties of these systems in a temperature range where any experimental study of ASW was deemed to be impossible. |

|
Figure 5. Relaxation kinetics in ASW, and water. Open circle at 205 K: the maximum possible enthalpy relaxation time from our experiments. Shaded region: the range of possible enthalpy relaxation time values at various temperatures. Solid line: the Vogel-Fulcher-Tamman fit of relaxation time data obtained in our experiments. Other symbols and lines: previous studies of relaxation kinetics in ASW.
|
|
Figure 6. Variations of the dynamic glass transition temperature of ASW as a function of concentration of impurities (CH3COOH) |