A Mathematical Look at Politics

Links:
-
 Coauthor, Dan Ullman
 -
Publisher’s web page on the book.
-
Amazon dot com

The cover shows two views of a map of the US with states made of squares corresponding to their numbers of electoral votes based on the 2000 census. The number of electoral votes each state gets is equal to its number of House seats plus two.
The top picture shows the electoral votes for the 2004 presidential election, with votes for Bush in red and votes for Kerry in blue. The bottom picture shows the electoral vote for the 2008 presidential election, with votes for McCain in red and votes for Obama in blue.
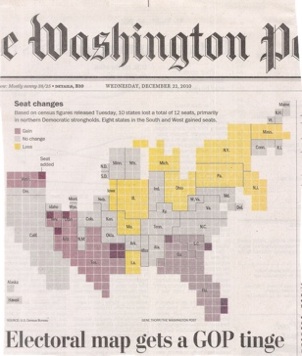
The result of the 2010 Census that will be used for the apportionment that determines electoral votes in the 2012, 2016 and 2020 presidential elections. The picture to the left, from the December 22, 2011 Washington Post shows the results of the 2010 Census. For a map of the electoral votes in 2012 see here including an account of the gains and losses since 2000.